At a glance: Build your own customized dashboards inside AppsFlyer. You can easily select, name and position the data in your own customized reports.
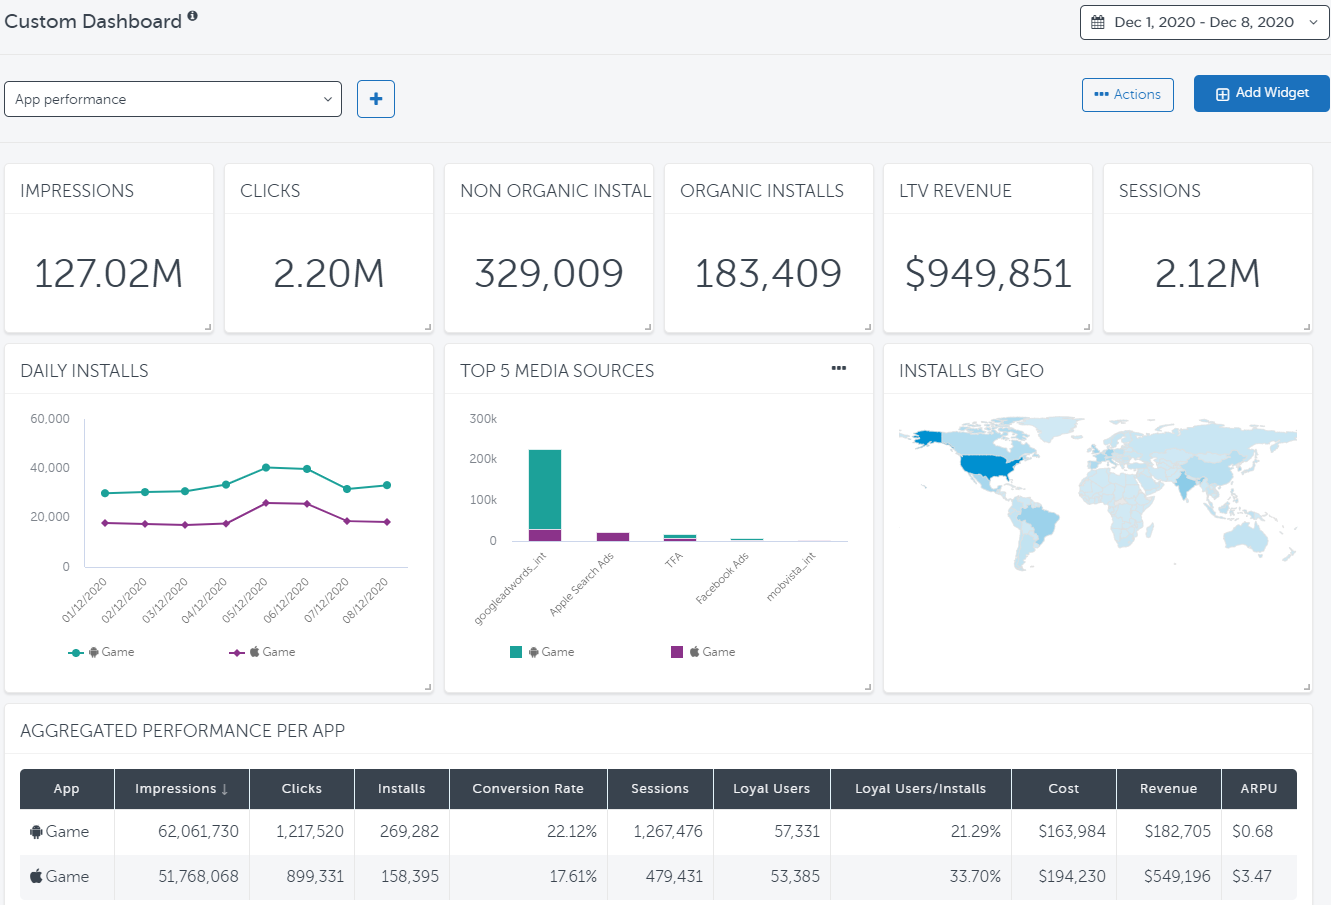
Custom Dashboard
A Custom Dashboard consists of one or more widgets containing user acquisition metrics. You configure the widget using the widget wizard to select metrics, presentation format, apps, and so on.
The metrics available are similar to the user acquisition metrics available in the Overview dashboard.
Having defined a Custom dashboard, it is available to all team members in the account.
Dashboard personalization
You can personalize a dashboard by moving and resing widgets.
| Option | Description |
|---|---|
| Resize widget | Drag the bottom-right corner of a widget to resize it |
| Widget position | Drag and drop a widget to change its location in a dashboard |
| Actions |
Hover-over a widget in the top-right corner, click actions. The following actions are available per widget:
|
Procedures
Managing dashboards
| Action | Description |
|---|---|
| Duplicate | Makes a copy of the current dashboard |
| Rename | Change the dashboard name |
| Export PNG | Creates and downloads a PNG file |
| Delete | Remove the dashboard |
Add a custom dashboard
To add a custom dashboard:
- In AppsFlyer, go to Dashboard > Custom Dashboard.
A dashboard displays. - Click + (Add new dashboard).
- Enter Your dashboard title.
- 点击添加
- Add one or more widgets as described in the section that follows.
Managing widgets
To add a widget:
- Click Add widget.
- The widget window displays.
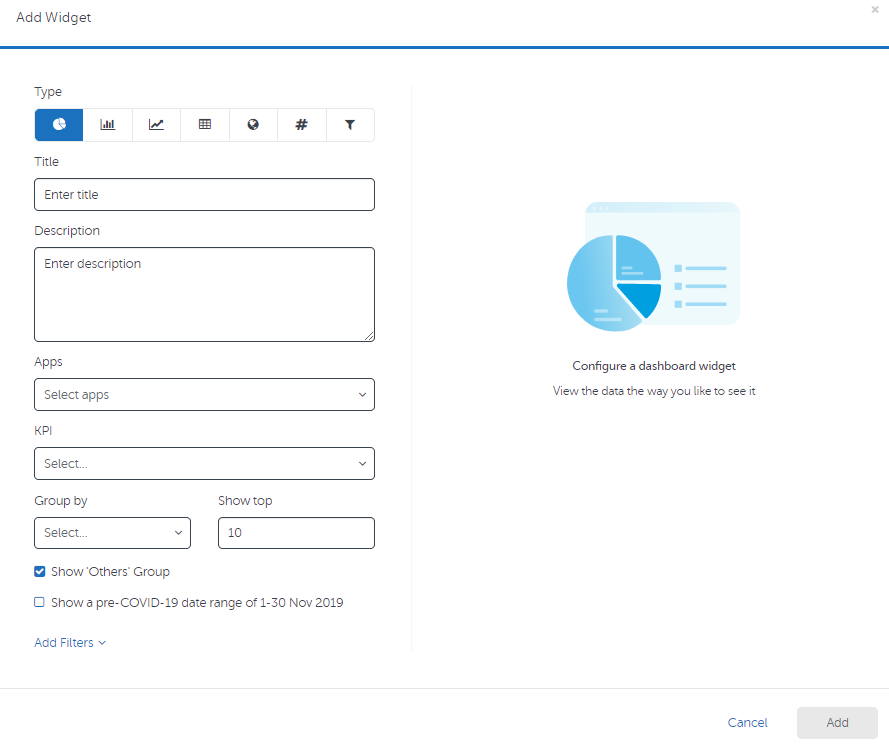
- Configure the widget. Use the widget settings guide that follows.
- Add more widgets as required.
| Setting | Description |
|---|---|
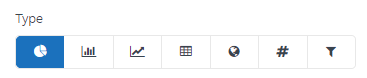
| Widget type |
Select a widget type:
|
| Description | Enter a widget description |
| Apps | Select 1 or more apps to include in the widget data |
| KPIs |
|
| Group by | Select group by |
| Show top | Enter the number of values to display. |
| Pre-Covid |
If selected, show data of a pre-COVID-19 date range of November 1-30, 2019. |
| Filters |
Use include filters to limit data in the widget:
Select Exclude organic to explicitly exclude data not attributed to a media source. |
Export widget data
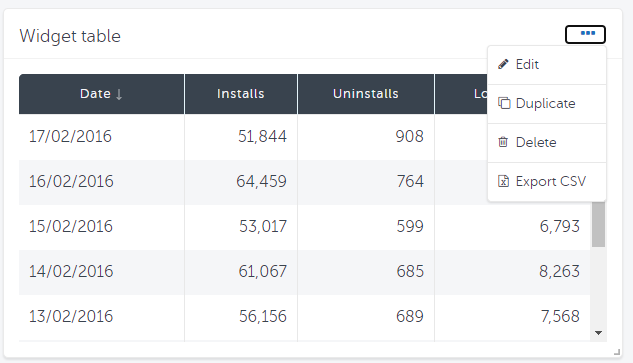
To download widget data to a CSV file:
- Select Actions in a widget.
- Select Export CSV.
The file downloads.
Dates in CSV files have the format dd/mm/yyyy. You can convert them to a different format, like mm/dd/yyyy in Excel.
Traits and limitations
Traits and limitations
| Trait | Remarks |
|---|---|
| Ad network access to report | No |
| Agency access | No |
| Agency transparency | Yes |
| App-specific time zone | If all apps housed in the account have the same time zone setting: data displays using the app-specific time zone. If this is not the case: data displays in UTC. |
| App-specific currency | If all apps housed in the account have the same currency setting, data displays in app-specific currency. If this is not the case data displays in USD. |
| Organic data | Available |
| Non-organic data | Available |
| Data freshness | Real-time. Equivalent to the Overview Dashboard |
| Team member access | Yes |
| 限制 |
|