At a glance: View user acquisition LTV in-app event performance metrics across media sources and use them to optimize your campaigns.
Events dashboard access
To open the Events dashboard:
- In AppsFlyer, from the side menu, select Analyze > Events.
- At the top of the page, set filters as follows:
- Media source
- Geo
- LTV period
Considerations:
- The dashboard is limited to events attributed to user acquisition campaigns (UA). This includes events double-attributed in the context of a retargeting engagement.
- The date range in the dashboard relates to the LTV (install) date. Use the Activity dashboard to get metrics based on the actual date of the user action.
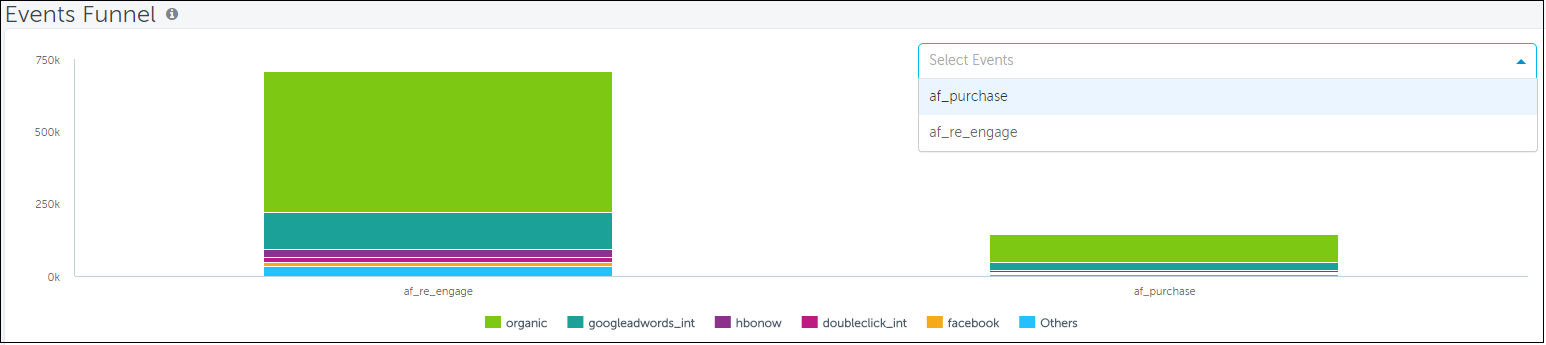
Top Events Chart
- By default, the Top Events Chart displays the in-app events with the most actions. You can select the in-app events that interest you.
Events Drill Down table
- The table can be grouped by campaign or event.
-
Information presented in the table relates to users acquired during the LTV period.
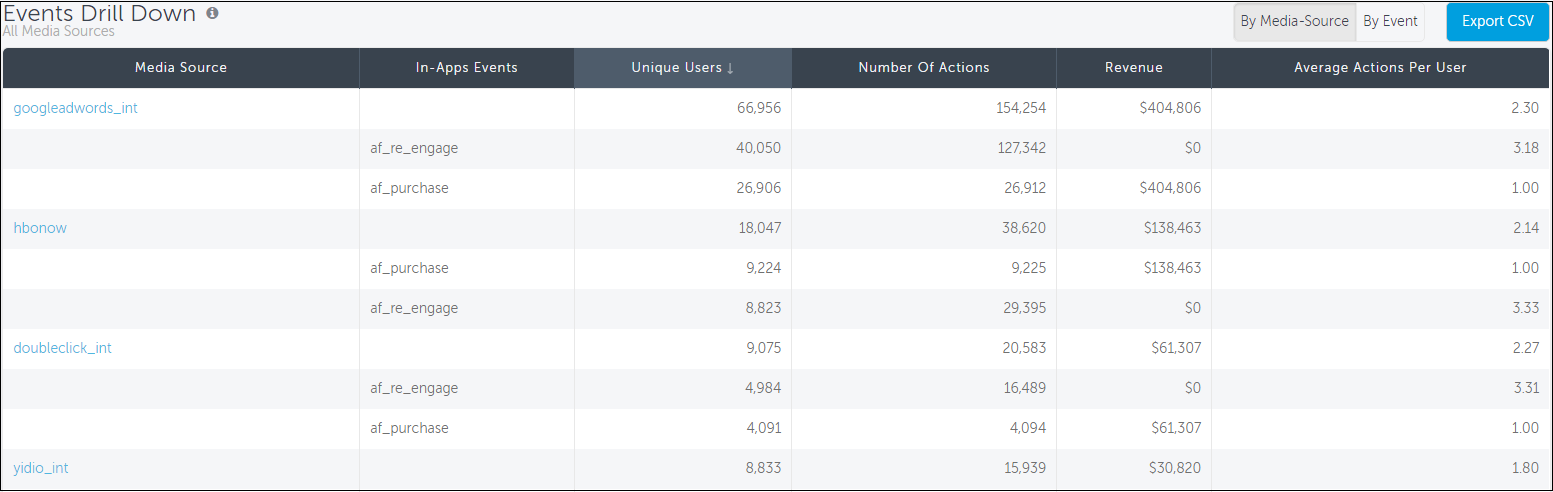
- Media source: Attributed media source.
- In-app events: Name of the in-app event reported by the SDK.
-
Unique users: Number of unique users (attributions with a unique AppsFlyer ID) who performed the event.
For Organic in-app events, re-installing users don't increase the unique users count, so the number sometimes appears as zero. - Number of actions: Total number of actions means the number of times the in-app event was performed by users.
- Revenue: Revenue generated from the in-app events.
- Average actions per user: The number of actions/unique users.
Traits and limitations
- Currently, the Events dashboard does not fully reflect campaign name changes.
- Events dashboard isn't available to ad networks.
- Historical data: Historical data for LTV metrics is available for up to 25 months (2 years + 1 month).
Tip
Want to understand more about your event data? Check out this short, informative course on the AppsFlyer Learning Portal.