At a glance: The SKAdNetwork (SKAN) dashboard displays campaign metrics reported via iOS SKAN postbacks and additional data points during initial user measurement windows. Modeled metrics which consider null conversions are also available. Data displays using the install or postback arrival date.
Dashboard principles
The dashboard contains SKAN campaign performance data and adheres to the following principles:
- Consider that Apple, due to a privacy threshold mechanism, doesn't always populate the conversion value (CV). These are referred to as null CVs. In the case of null CVs, only an install is recorded.
- Metrics are calculated as follows:
- Non-organic metrics in the dashboard are calculated using SKAN postback data received by AppsFlyer. Some metrics like redownloads, source app ID, and fidelity type metrics require that you configure your app to send postback copies directly to AppsFlyer.
- Organic metrics are calculated as AppsFlyer attribution data minus SKAN non-organic attribution data. Note: Organic metrics aren't always available. Learn more.
- Make sure you filter by New installs in the install type field.
- Some metrics, like revenue and ROAS, have both the original value derived from postbacks and a modeled value that considers the null CV rate.
- Agency-driven traffic is treated as coming from a transparent agency.
- Data freshness:
- Daily.
- Postbacks received on a given day are processed at the end of the day UTC. Data is available by 08:00 UTC of the following day. Meaning postbacks received on Monday are available in the dashboard on Tuesday morning.
- See expected dashboard update time.
SKAN dashboard view options
Display data using either the install date or postback arrival date.
To select a date display option, in AppsFlyer, from the side menu, select Analyze > SKAN Overview. In the filter bar, select a Display by date option.
Additional filters and display options are described in the sections that follow.
Dashboard use
Dashboard settings
Dashboard settings are available when your app uses legacy fixed-mode conversion measurement to select the conversion event.
To select the conversion event:
- In the upper-right side of the dashboard, click Dashboard settings.
- Select a conversion event.
- Click apply.
Conversion metrics are calculated using this event.
Note! This setting relates to the display in the dashboard and doesn't affect the CV setting in the app.
Filter options
Use filters to refine the information displayed.
| Filter | Remarks |
|---|---|
| Display by |
|
| Date range |
|
| Media source |
|
| Campaign |
|
| Site ID |
|
| Geo |
|
| Install type |
|
| Adset | Available if the ad network provides this data point |
| Ad | Available if the ad network provides this data point |
| Version | The SKAN version |
Headline metrics
| Metric | Remarks |
|---|---|
| Installs | SKAN does not report installs if the user did not engage with an ad prior to the install. AppsFlyer calculates the organic metrics using AppsFlyer attributed installs (LTV dashboard.)
|
| Touchpoints | Ad networks report impressions and clicks by click or API. |
| Total Revenue |
|
| Cost |
|
| Click-to-install rate | Click-to-install rate. |
| Adjacent period trend | Trend values in % indicate the change of the current metric relative to the metric of the previous equivalent period. For example, if the current period is May 1-10, the previous period is April 21-30. |
Charts
The charts available depend on the selected measurement type.
| Chart metric | Remarks | ||||||||
|---|---|---|---|---|---|---|---|---|---|
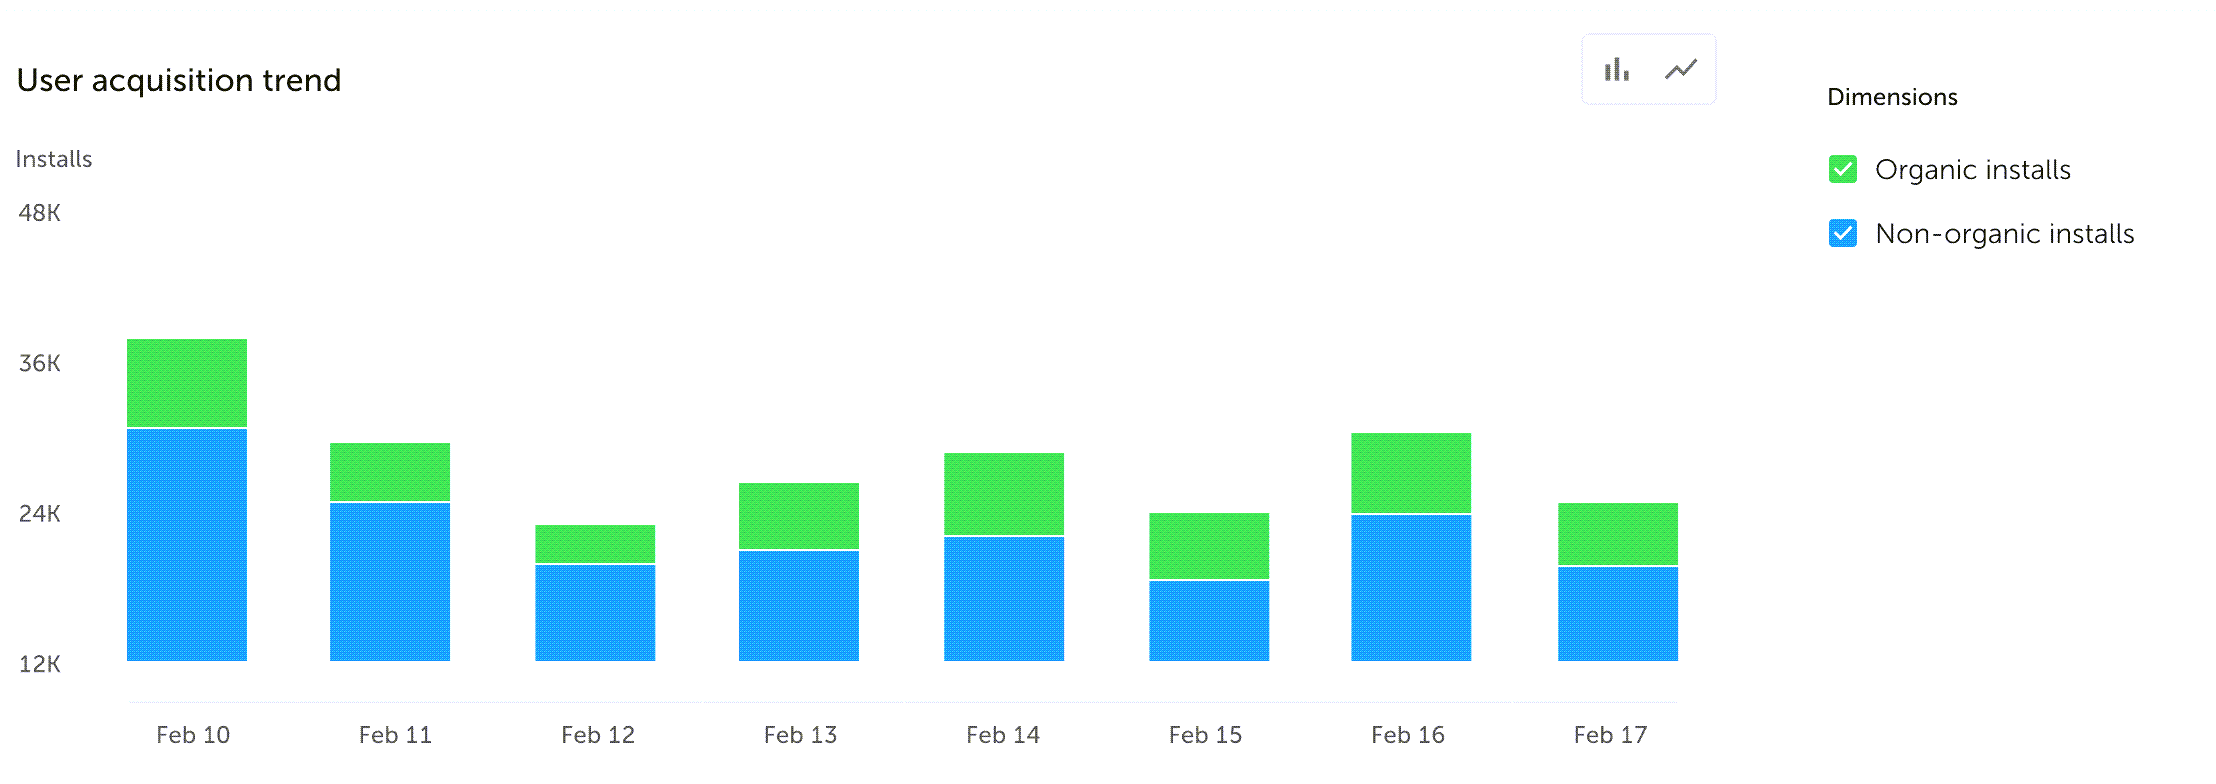
| User acquisition trend |
Dimensions available:
|
||||||||
| Touch to conversion |
Views available:
|
||||||||
| Installs per day grouped by advertising hierarchy element | Elements available: Media source, Campaign, Site ID, Adset, Ad,Version |
||||||||
| Metric breakdown by advertising hierarchy elements |
Elements available: Media source, Campaign, Site ID, Adset, Ad, Version |
||||||||
| Top events |
Top events contain both organic and non-organic users. Use the media source filter, at the top of the page, to distinguish between organic and non-organic users or per selected media sources. |
||||||||
| Top countries |
Note: This chart is available to agencies and not to advertisers |
||||||||
| Postback copy |
This chart is available after you configure the app to send iOS 15+ postback copies to AppsFlyer. If no chart displays, consider that:
Notes:
|
Metrics
- Select metrics from those available. Modeled metrics consider the null CV rate.
- Set the primary and secondary groups by dimensions to drill down into performance metrics.
About the metrics table:
- Use the table to compare the performance of campaigns and media sources.
- Initially, the top 20 media sources display, sorted by the number of installs in descending order.
- To sort the table, click on a column header. Click again to reverse the sort order.
- Cost-related metrics (cost, impressions, and clicks) are available if at least 1 install is associated with a given campaign. Note:
- Campaigns with 0 installs don't display at all.
- Some ad networks, report cost-related metrics at the adset and ad level, but report the install at the campaign level. In this case, the adset and ad cost-related metrics display with an install metric of 0.
- Attributed touch-type dimension limitation: Cost-related metrics can't be broken down and display as Unknown.
Table metrics:
| Metric | Formula/remarks |
|---|---|
| Installs |
|
| Null conversion value rate | Postbacks having a null conversion value/Installs * 100 |
| Impressions | |
| Clicks | |
| Click-to-install rate | Installs/Clicks * 100 |
| Converted users |
Count of unique users performing a designated measurement event.
Organic converted users traffic are not shown in the SKAN dashboard |
| Converted users/Installs | |
| Total revenue | Revenue, including modeled data of null values. Learn more |
| Total revenue (unmodeled) | Revenue reported via the conversion values. Modeled data not included |
| Revenue D1-D2 | Revenue for SKAN window 1 (days 1-2 unless modified), including modeled data of null values. Learn more |
| Revenue D1-D2 (unmodeled) | Revenue received in SKAN window 1 (days 1-2 unless modified). Modeled data not included |
| Revenue D3-D7 | Revenue for SKAN window 2 (days 3-7 unless modified) |
| Revenue D8-D35 | Revenue for SKAN window 3 (days 8-35 unless modified) |
| Cost |
|
| ARPU |
|
| ARPU (unmodeled) | Average revenue per user, modeled data not included |
| ROI |
|
| ROI (unmodeled) | Return on investment, modeled data not included |
| ROAS |
|
| ROAS (unmodeled) | Return on ad spend, modeled data not included |
| eCPI | |
| In-app event metrics | |
| In-app event name | |
| eCPA |
|
| eCPA (unmodeled) | Effective cost per action, modeled data not included |
| Total event count | Total event occurrences across all windows, including modeled data of null values. Learn more |
| Total event count (unmodeled) | Total event occurrences across all windows, modeled data not included |
| Event count D1-D2 | Event occurrences for window 1 (days 1-2 unless modified), including modeled data of null values. Learn more |
| Event count D1-D2 (unmodeled) | Event occurrences for window 1 (days 1-2 unless modified), modeled data not included |
| Event count D3-D7 | Event occurrences for window 2 (days 3-7 unless modified). |
| Event count D8-D35 | Event occurrences for window 3 (days 8-35 unless modified). |
| Event unique users D1-D2 | Number of unique users who performed the event for window 1 (days 1-2) |
| Event unique users D1-D2 (unmodeled) | Number of unique users who performed the event for window 1 (days 1-2 unless modified). Modeled data not included. |
| Event unique users D3-D7 (unmodeled) | Number of unique users who performed the event for window 2 (days 3-7 unless modified). Modeled data not included. |
| Event unique users D8-D35 (unmodeled) | Number of unique users who performed the event for window 3 (days 8-35 unless modified). Modeled data not included. |
Modeled metrics and null CV
SKAdNetwork (SKAN) reporting can be limited because:
- SKAN relies on conversion values (CVs) that are limited to 6 bits, resulting in 64 possible values (0-63).
- Apple sometimes withholds the actual CV (and returns data as "null") to preserve user privacy.
- Data is only available from within a measurement window and full lifetime value (LTV) isn't known.
SKAN modeled data solves these issues, providing:
- Modeled conversion values instead of null values.
- Modeled revenue and event occurrences.
- A more complete picture regarding app and campaign LTV performance.
Modeled metrics available include:
- Revenue
- Event count
- eCPA
- ARPU
- ROI
- ROAS
AppsFlyer attribution vs. SKAN attribution
SKAN metrics differ from those available using the AppsFlyer attribution model. The table that follows enumerates the main causes.
Definitions:
- Times: Assume the default activity window of 24 hours (48 hours once you upgrade to SKAN 4).
- SDK: AppsFlyer SDK embedded in the app.
- Rules: AppsFlyer attribution model
Attribution framework differences
| Concept | SKAN | AppsFlyer |
|---|---|---|
| Attribution methodology supported |
Apple SKAN for click- and view-through attribution. Contains traffic of app-to-app campaigns of ad networks and SRNs supporting SKAN.
|
AppsFlyer attribution model supports multiple attribution methods and scenarios:
|
| Primary data source |
|
SDK and associated solutions. Example: Server-to-Server events. |
| Data freshness | SKAN data freshness. | Real-time when the user launches and uses the app. |
| Time zone | UTC | App-specific time zone. |
| Install time | Derived from the iOS postback arrival time. | Reported by SDK. |
| Activity window | User activity during a fixed measurement window, starting with the app open. |
Contains LTV data from the install date until the present. Use Cohort to view data limited to cohort day 0 or cohort day 1, or both together to view a comparable measurement period. Consider, cohort day 0 consists of less than 24 hours of activity. For example, a user installing at 18:00 on a given day has 6 hours of activity on cohort day 0. |
| Installs reported by |
|
SDK reports all installs categorized using Rules into first-time installs and retargeting reinstalls (re-attributions). |
| Advertising granularity level | Campaign, adset, adset ID, ad, and ad ID. | Full hierarchy: Campaign, campaign ID, adset, additional parameters like channel and partner. |
| Redownloads vs. reinstalls | Redownloads relate to the actions of a given Apple ID user. They are not parallel to re-attributions. | Retargeting (re-engagements re-attributions) reflect in the Retargeting dashboard. They are not parallel to redownloads. |
Metric differences
| Metric | SKAN | Traditional attribution |
|---|---|---|
| Non-organic installs |
Count of valid iOS postbacks received by AppsFlyer. Consider, AppsFlyer doesn't get the postbacks of ad networks that haven't completed SKAN integration with AppsFlyer. This can lead to undercounting of non-organic installs and increased organic installs. |
|
| Organic installs | SDK installs minus SKAN installs. |
|
| Revenue |
Non-organic: Revenue reported by SKAN postbacks. Organic: Revenue reported by SDK in-app events minus non-organic revenue. Note: Organic metrics aren't always available. Learn more. |
|
| Ad revenue | Available | User-level ad revenue is attributed based on IDFV |
| ROI/ROAS | Revenue during the measurement window. |
|
FAQ—SKAN discrepancies
| Reason | Discrepancies—Q&A |
|---|---|
| A |
Q: Why do the conversion numbers in the AppsFlyer dashboard differ to that of the ad network dashboard? A: Reasons for discrepancies
|
| B |
Q: Differences between the SKAN performance API and dashboard versus the SKAN aggregate postback API? A: The postback API date range relates to the date on which AppsFlyer received the postback. The performance API date range relates to the install date derived as described in reason A. |
| C |
Q: Do all ad networks report the Geo? A: No. |
| D |
Q: Why are there differences between the Overview dashboard and the SKAN dashboard. A: See the preceding section for an overview as to reasons for discrepancies. |
Traits and limitations
| Trait | Remarks |
|---|---|
| Modeled event occurrences |
|
| Postback arrival date | The final date in a date range is limited to the day when the last install was recorded. |
| Organic data |
|
| Historical data | Earliest conversion data supported: November 1, 2020 |
| Currency | Displays in USD or in the app-specific local currency as set on the app settings page. |
| Timezone | For SKAN-reported data, installs and events display using UTC, with the exception of Meta and Google SKAN data, for which the timezone is based on the timezone configured in your Meta and Google accounts, respectively. |
| Filter by SKAN version | For some media partners, unknown is displayed. This is because they do not currently provide that field.
|
| Apple Search Ads | Apple Search Ads does not share campaign-level data. Any agency campaigns that require a prefix will not appear in the agency view. |